Follow the money
see where your tax dollars go.
Fiscal Trim turns public data into clear, interactive insights. First, select the entity you want to explore, then enter its name into the box below to view its data.
Built for fiscal transparency.
Everything you need to understand, compare, and share how public money flows.

Universal search
Type a city, county, school district, or pension plan and jump straight to 12 years of audited data.

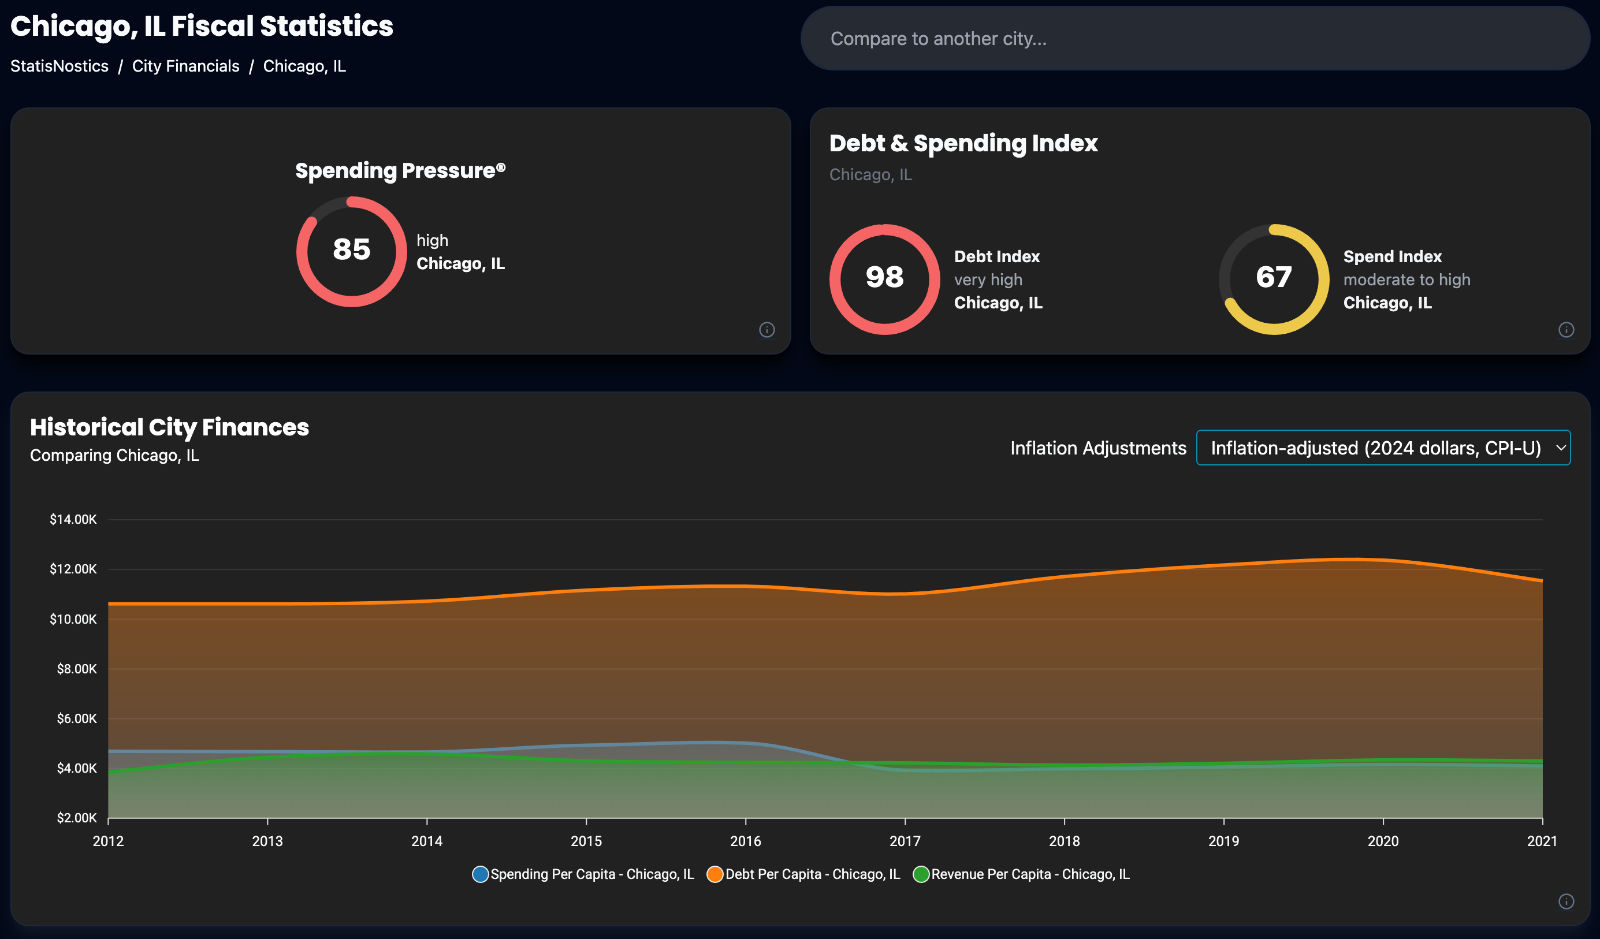
Trendlines (inflation‑adjusted)
Compare apples to apples from 2012 through the latest public filing.

Interactive drill‑downs
Click any bar, pie slice, or table cell to reveal the exact departments, programs, or bond issues behind it.

Proprietary health scores
Instantly grasp fiscal stress with our Spending Pressure®, Debt Index, and Taxes‑to‑Interest™ ratios.

Peer benchmarking
Stack your community against regions of similar size, economy, or tax base and spot outliers fast.

Shareable links
Shareable links with presentation‑ready graphics so insights travel beyond the dashboard.
Go deeper with Fiscal Trim Pro.
Unlock advanced tooling designed for analysts, journalists, and watchdogs who need the full firehose.
Bulk data & API
Stream Fiscal Trim data into your own apps and models with flexible REST API endpoints.
Custom dashboards
Save filtered views and auto‑refresh charts for public meetings, watchdog portals, or newsrooms.
Automated alerts
Get email or Slack pings when new data lands or when a metric crosses your risk threshold.